

Today’s discussion might be a little less exciting than yesterday because although I now have all this cool data on finances going back to 1920, holy hell are there some difficulties coming up with way to provide a unified data series through that period. So, apologies, but you’re in for some long parenthetical statements on methodology.
The main reason I was looking for historical data in the first place was that I was trying to resolve a long-standing puzzle around federal investments in higher education. And by puzzle, I mean a largely evidence-free debate that has raged for years about the extent to which federal expenditures either “led” higher education growth in the 1950s and 1960s and whether cuts to this funding in the 1990s were as almighty bad as people have made out. Here’s what I found out.
A little bit of history first. From 1951 to 1967, the Government of Canada paid money to universities via an unconventional transfers system. Basically, it gave millions of dollars every year to what is now Universities Canada to hand out to its members: about $7 million in 1951, rising to maybe $40 million or so in the mid-60s. It also provided tens of millions for capital funding and research, but the Universities Canada money was the big piece. Then in Pearson’s second term, the feds moved to an extremely generous system which involved paying the provinces fifty cents for every dollar they were spending on post-secondary education (though some of this was paid through what are known as “tax points,” which are way too boring to describe here). This was trimmed in a couple of ways over the next few years as the feds came to know how expensive it was to let provinces (or anyone, really) spend fifty-cent dollars. In 1977, the feds merged its funding for post-secondary education with funding for health in what was known as “Established Programs Financing” or EPF. This new transfer lasted until 1995 when it was merged with welfare funding to create the Canada Health and Social Transfer, which then became Canada Social Transfer.
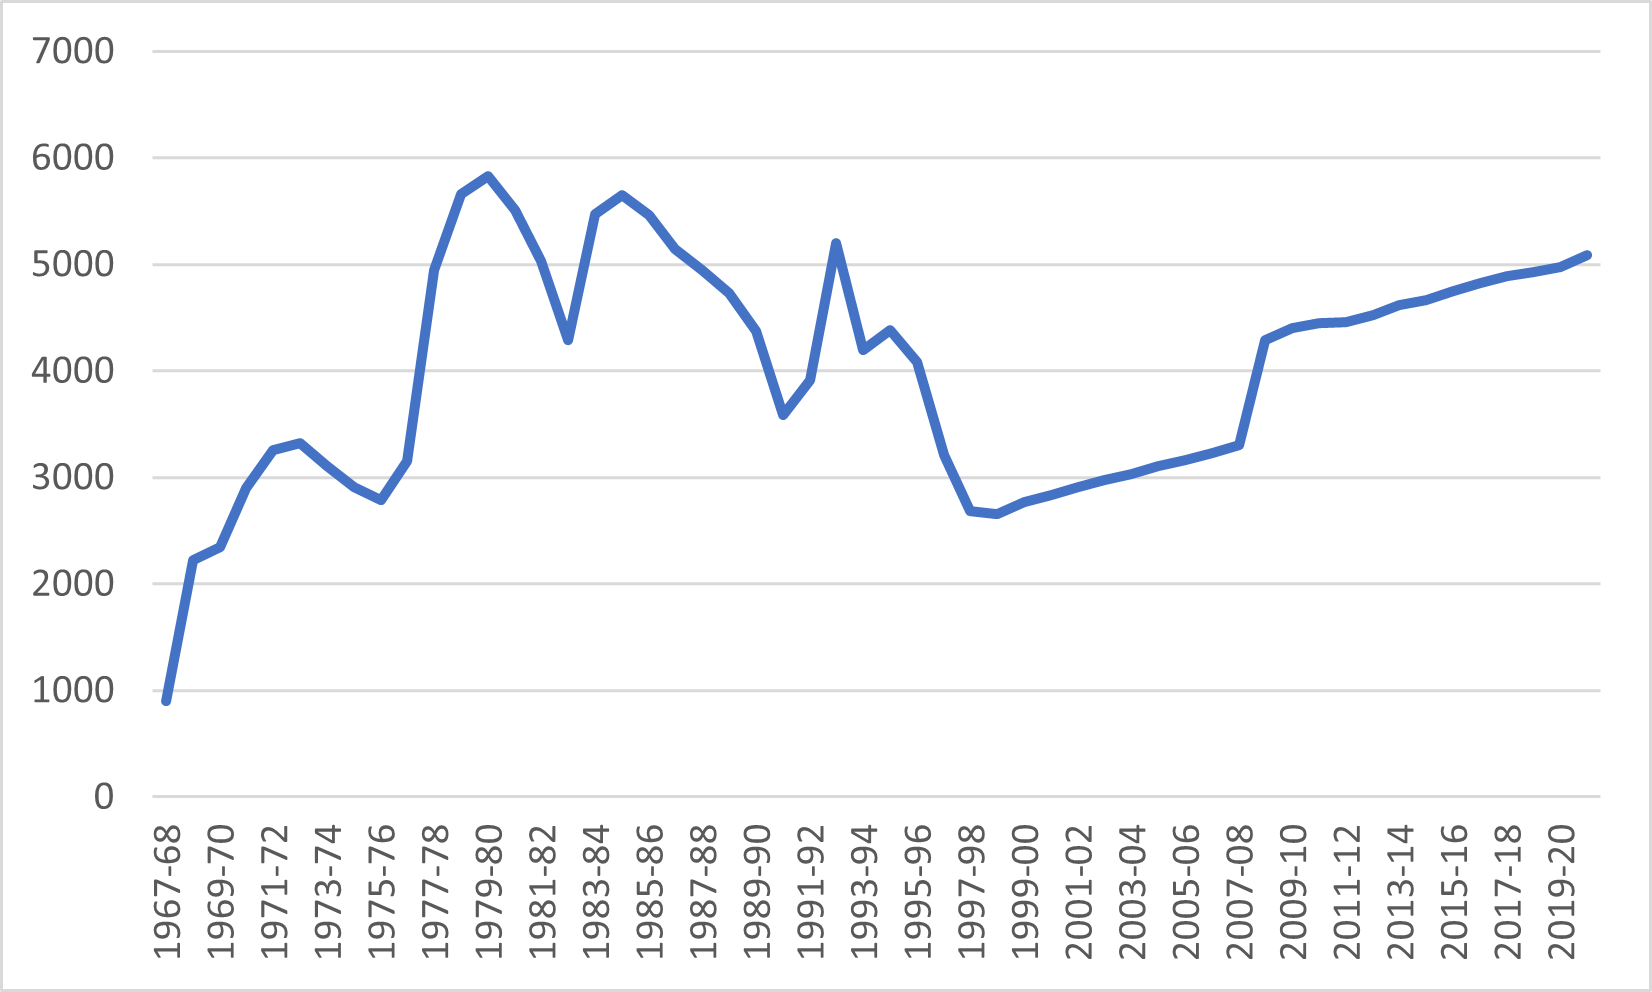
Technically, from the start of EPF until the Harper budget of 2007 which established a designated (if notional) post-secondary portion to the Canada Social Transfer, there was no actual “amount” of transfers designated “for” post-secondary. However, there were some rules of thumb during the EPF period (and are available in this unbelievably valuable book published 25 years ago by the Canada Tax Foundation – thanks to Trevor Tombe for pointing me to this) and at least for the first few years of the CHST period, you can make some estimates based on the idea that cuts were being spread equally across both health and PSE. Where it gets complicated is between about 1999 and 2006: CHST money was increasing but mostly designated for health, and then after the CHT/split it’s just a mess until the Harper 2007 budget. But if you just assume a slow steady climb between the figure for 1999 and the figure for 2007, then the path of federal transfers looks something like it does in Figure 1.
Figure 1: Implicit/Explicit Federal Transfers to Provinces in Respect of Post-Secondary Education, 1987-68 to 2020-21, in millions of constant $2022.
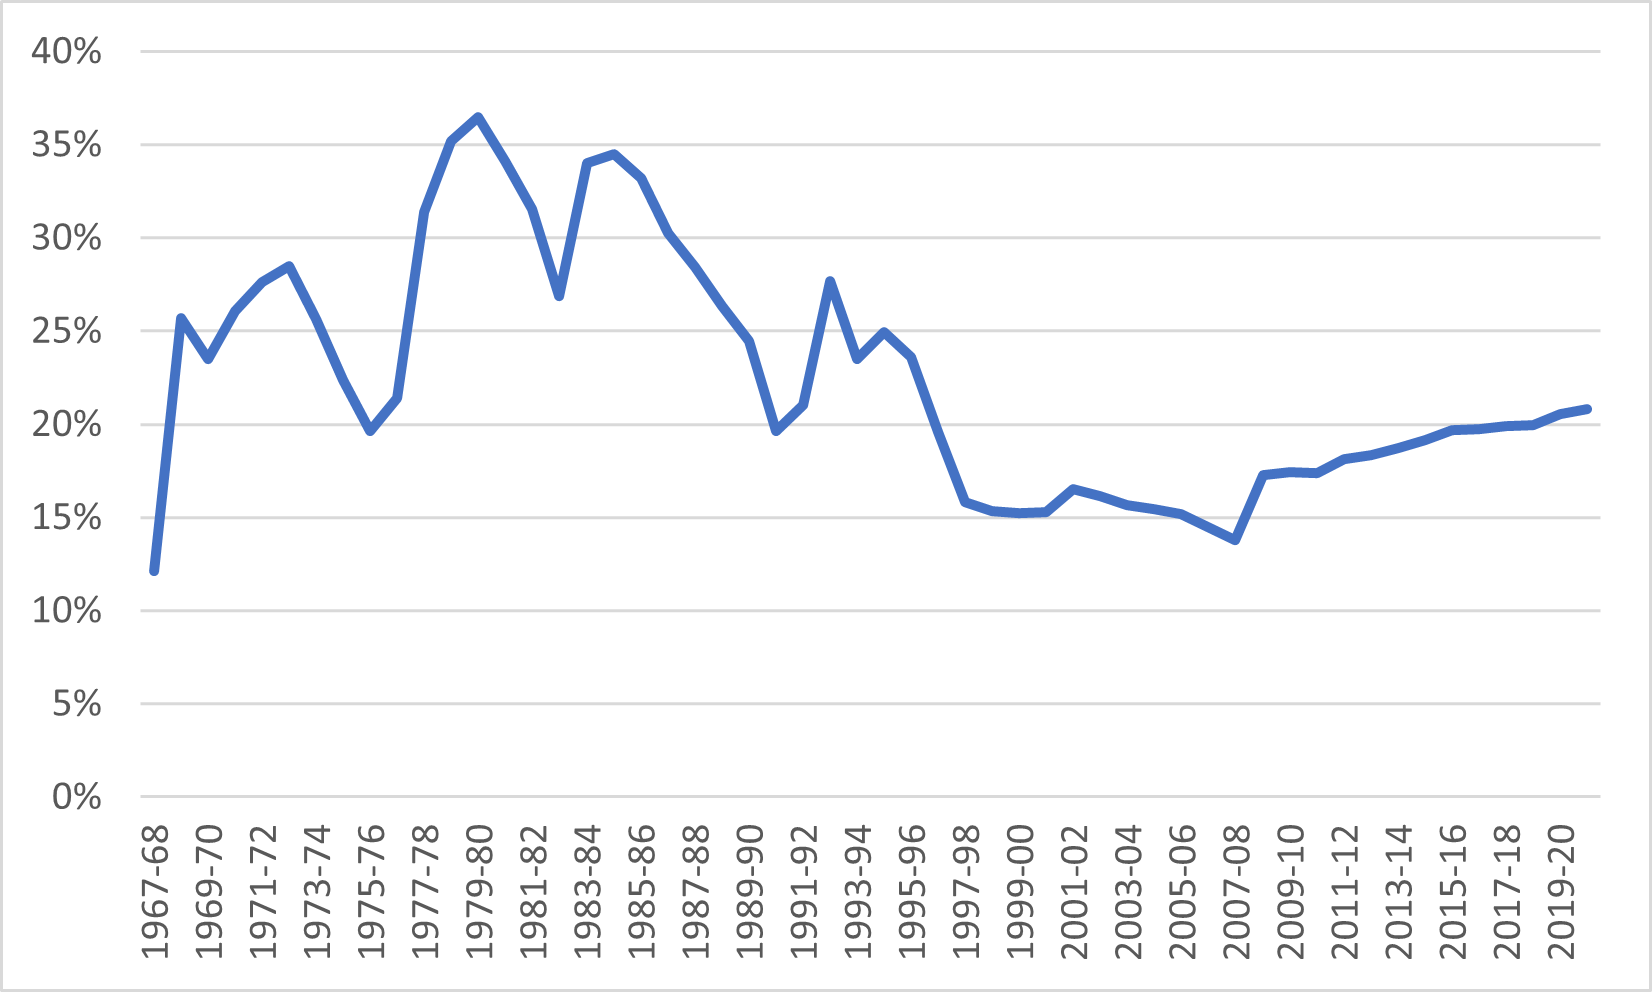
Now, the interesting question is: what percentage of total provincial funding to institutions does this represent? The answer is presented in figure 2.
Figure 2: Federal Transfers to Provinces in Respect of Post-Secondary Education as a Percentage of Total Provincial Spending on Post-Secondary Education, Canada, 1967-68 to 2020-21
But now let’s zoom out and take a look at total government expenditures on post-secondary education institutions. I have divided these into three types. The first is federal direct payments to institutions for research, infrastructure, etc. The second is federal transfers to provinces, and the third is total provincial transfers to institutions minus federal transfers, or what I call provincial own-source expenditures. These can all now be tracked back to when Statscan started collecting this data annually 65 years ago (though there is a three-year period from 1999 to 2001 where the data is a bit wonky because the pre- and post-2000 data sources don’t line up exactly). And the result is figure 3, below.
Figure 3: Total Government Transfers to Institutions by Source and Type, Canada, 1955-56 to 2020-21, in millions of $2022.
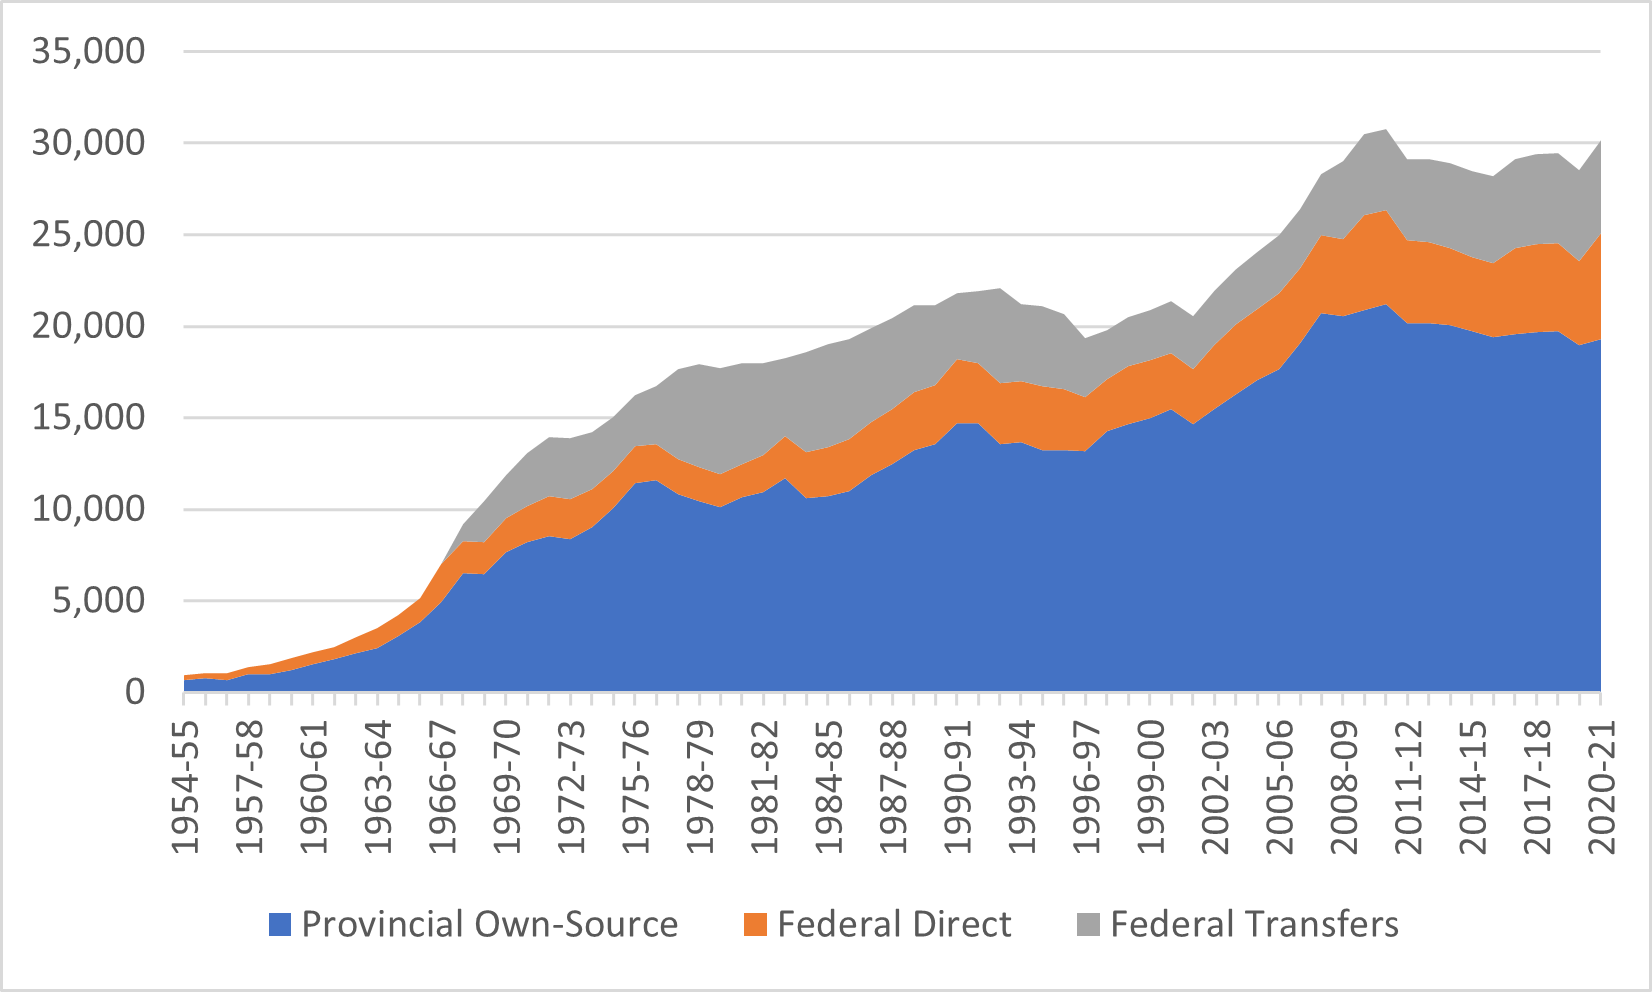
If we look over the history of these expenditures, three key things stand out. The first is that during the big twelve-fold expansion of higher education funding from 1955-56 to 1970-71, the federal government played essentially no role at all until after 1967. Basically, the arrival of federal funds in the form of transfer payments extended the party by 2-3 years. This is not quite the standard narrative about the catalytic role of the federal government in PSE spending.
The second is that while the 1990s were clearly something of a lost decade, if you look very closely at what happened in the 1990s, provincial own-source spending on PSE was declining before the feds cut provincial transfers in 1995 and rose somewhat to compensate for the loss of federal funds from 1996 onwards. Again, this is not quite the usual “the feds’ role was critical” story.
The third is that the years where the federal government was providing the greatest share of transfers to institutions wasn’t in the 1960s, or even in the 1970s, but in the mid-1980, when federal transfers and direct expenditures briefly made up as much as 44% of all government funding to institutions (for comparison, the current share is 36%). In fact, despite all the nostalgia for the 1960s, as late as 1967, the federal share of total expenditures was lower than it was in 1999 at the nadir of the Chretien/Martin cutbacks. Once more, not quite the standard narrative.
In short: beware 1960s nostalgia is usually wrong, and it’s always worth paying attention to the long game.
 Tweet this post

Hi Alex, Thanks for these posts!
I think the establishment of the Canada Millennium Scholarship Foundation in 1998 warrants consideration here as well. The $2.5 billion made its way directly into the pockets of students with the bursary and excellence programs and also served higher education in general through the research program.
The $2.5 billion was a significant investment.
Stefanie Ivan
Hi Stefanie. It was a big investment but would not beling on this graph because payments went to students rather than universities. And while it ended up giving out something like $3.6 billion over its 10-year existence, spread over that period of time it made up only about 7-8% of all student aid given out in those years, IIRC. More here: https://higheredstrategy.com/a-long-term-view-of-student-financial-aid-in-canada/
That’s some great analysis. Now that you have funding over time broken out by type I really hope the next data palooza breaks out the funding per student over that time. I suspect it will flatten the whole thing a bit more, but it would be really interesting to see if it makes the 60s look better on a per student figure or the 2000s look worse.