

I was sitting at home this weekend, reading the UNESCO World Science Report (2021), as one does, when I started poking around with the actual bibliometric numbers. And damned if there weren’t some big surprises in there.
First: what is the UNESCO World Science Report? Well, it’s a pretty interesting document which has appeared periodically since 1993. Over time, the document has become longer and more complicated. And for the last few editions, it has produced some statistical annexes examining scientific production in every country in the world. Sadly, the method of calculation has been a bit different each time so it’s difficult to string data together over a long period of time. But if you just restrict the analysis to the last ten years or so, the 2021 publication is pretty good.
Second: how does the report measure scientific output? It’s through annual publications in all fields except Arts, Humanities and Social Sciences, as measured through Scopus. Scopus is a bit of a moving target as the number of journals it indexes increases every year. But for the most part it is relatively consistent over time.
Now many people look at international stats to see how rich countries are faring against one another. But that’s boring. The answer is that to a fairly large extent they are pretty much the way they always were. There is not a lot of movement relative to each other. But get away from rich countries, and boy is it another story.
Figure 1 picks out the nine biggest movers in scientific output, showing the percentage growth between 2011-2019, among countries with a minimum of 400 publications in 2011. The biggest gainers? Iraq and Indonesia, which have both increased their output 13-fold (though in Indonesia I am sure that this was more than partly due to the inclusion of Bhasa Indonesia journals in the Scopus database after 2018).
Figure 1: Countries with the largest proportional increase in Scientific Publications, 2011-2019
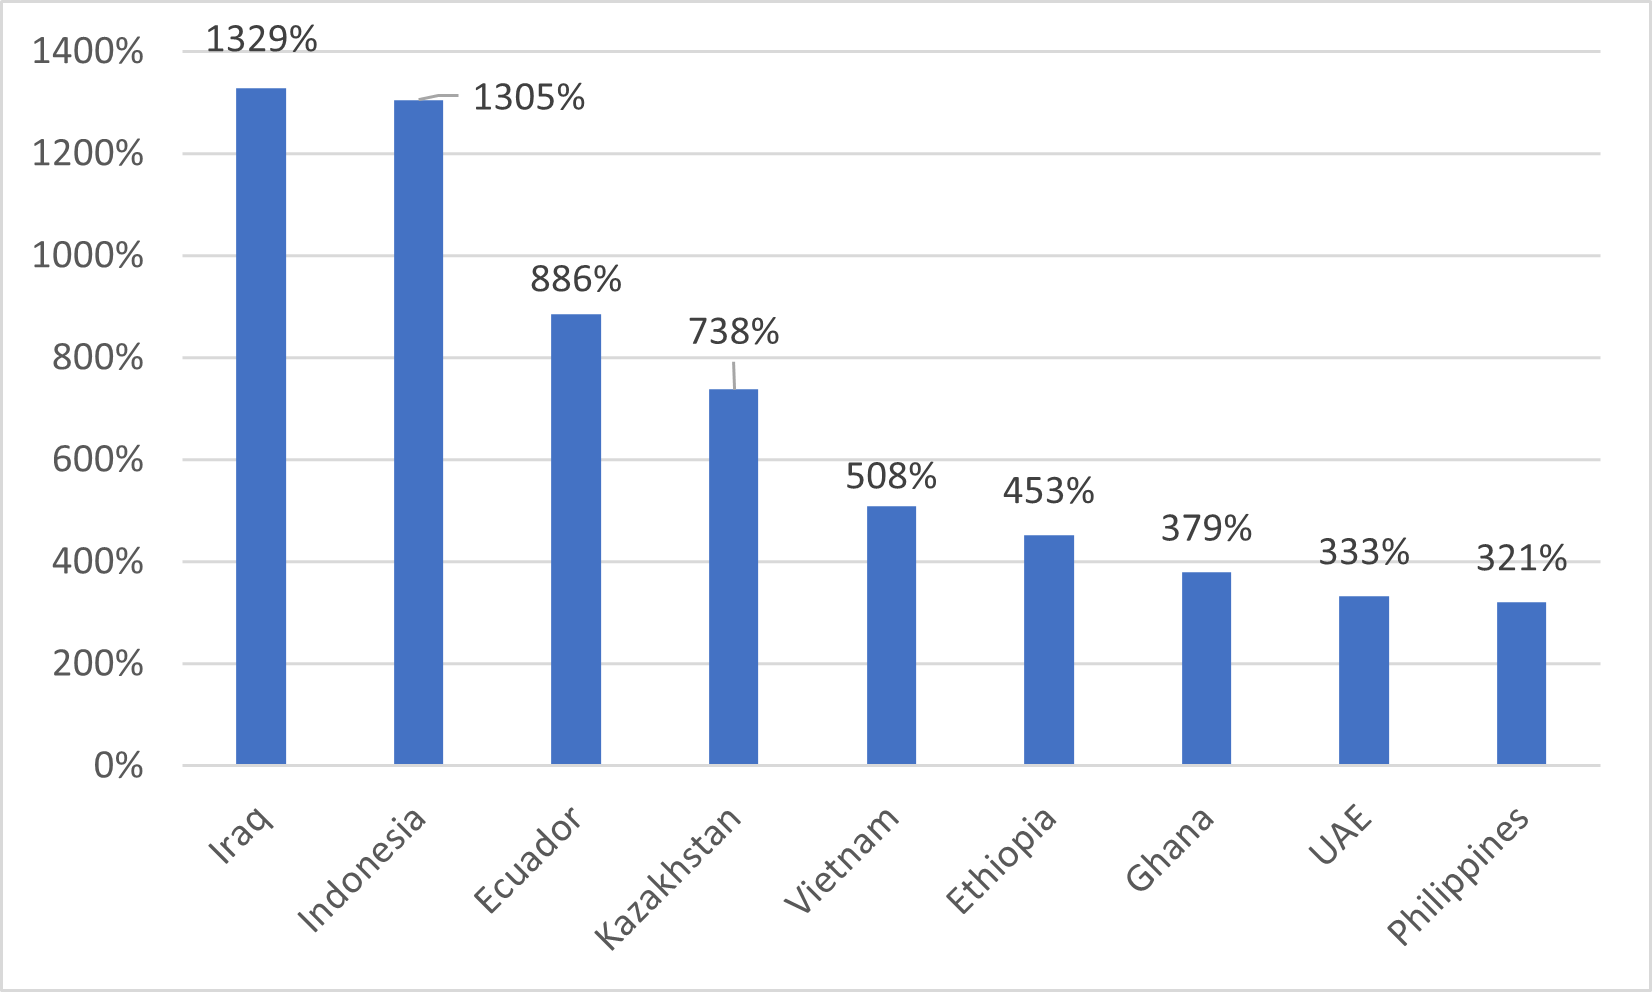
But those are hardly the only countries showing big jumps: Ecuador shows a nine-fold increase, Kazakhstan more than 7-fold, Vietnam and Ethiopia both 5-fold. These are frankly astonishing numbers. And it isn’t just countries of a particular “type” that are doing it. Yes, many countries have substantial oil/gas reserves and are investing some of it in higher education, but that doesn’t describe Vietnam, Ethiopia or the Philippines in the least. Though none of these are countries are global scientific powerhouses, they are places that are gathering speed for takeoff and could end up being quite important in a decade or two. If you’re looking to cultivate future stars, or partner with future up-and-coming universities, these are probably the places to go.
Now, the thing about most of the countries in Figure 1 – except for Indonesia, Vietnam and the UAE – is that they tend to have started the 2011-19 period with very low levels of publications. And low bases make it easy to show huge increases. So in Figure 2, I look at countries which a) started the 2010s with at least 2000 papers every year, b) grew at least twice as fast as the global average of 35% over the period 2011-19, c) didn’t show up in Figure 1 and d) aren’t India or China because everyone knows about them. That is to say, these countries, plus Vietnam, UAE and Indonesia from the previous graph (all of which meet these conditions), are what you might call the “significant” up-and-comers that are poised to make an impact in the near future.
Figure 2: Selected Countries with major proportional increase in Scientific Publications, 2011-2019
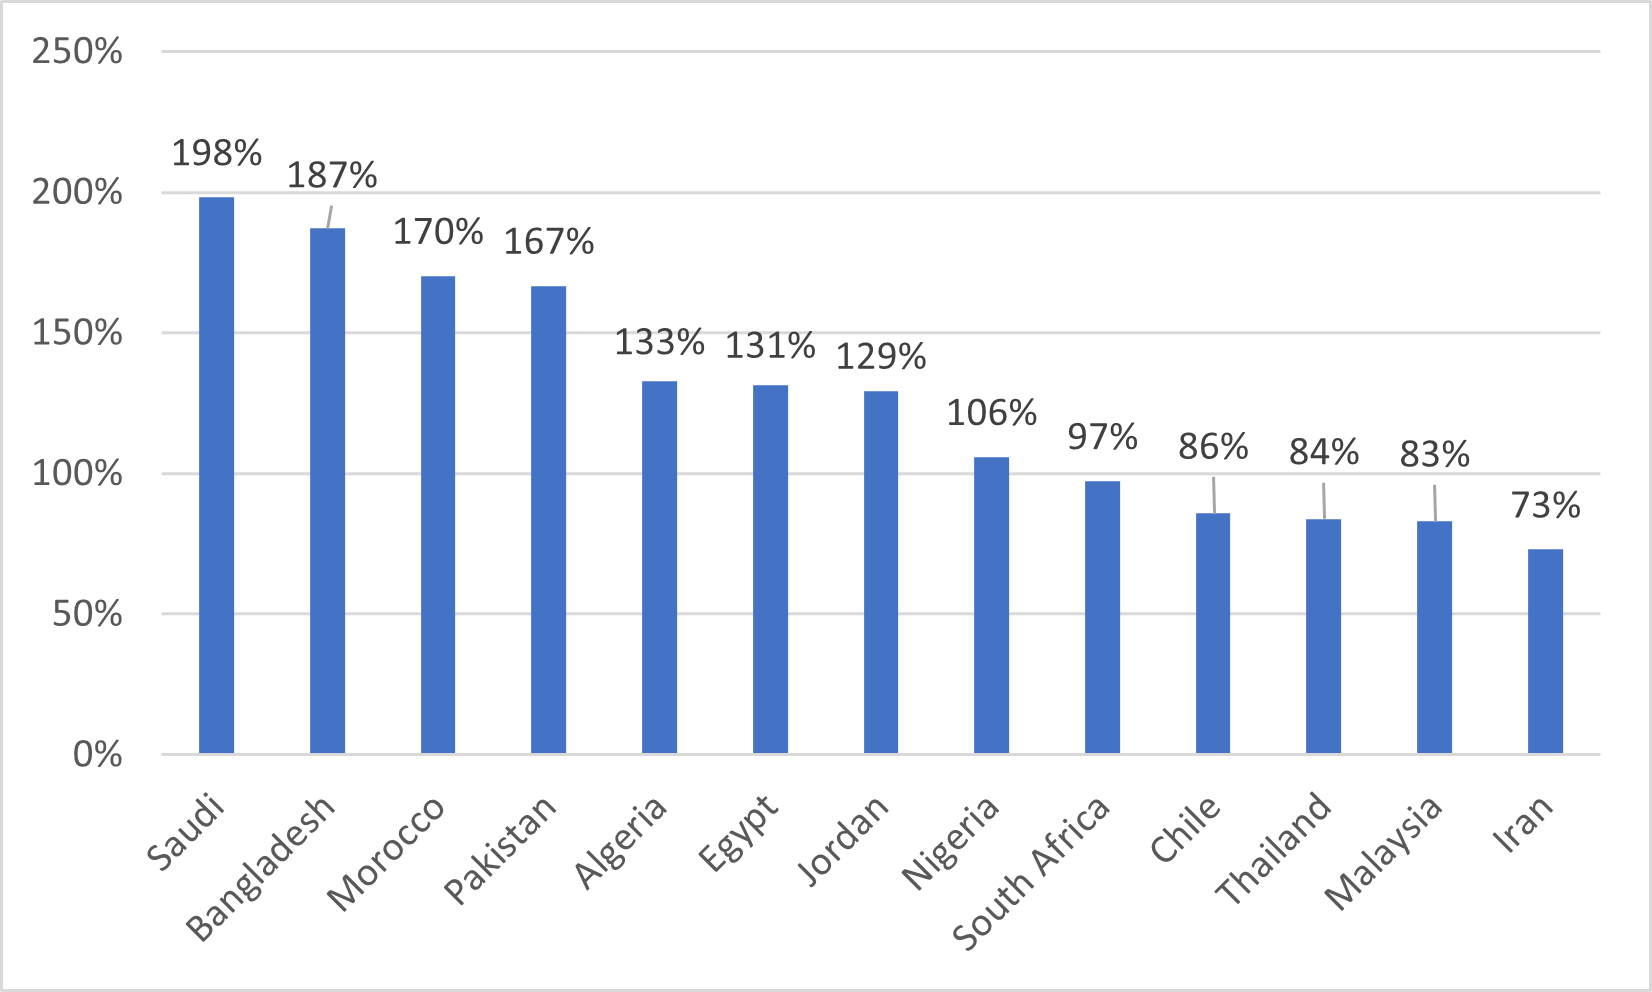
Again, this is quite a mix of countries. Of note perhaps is that nine out of the 13 countries are members of the Organization for Islamic Co-operation and a tenth (Nigeria) has a very significant Muslim population. If Islamic countries are on a path to catching up with the Global North in scientific publications, that could herald a very big shift in world science. Of the non-Muslim countries, South Africa has clearly made enormous strides in the past decade, as have Thailand and – interestingly – Latin America’s only real up-and-coming star, Chile.
Now, of the countries in this list, I want to draw your attention to one in particular: Iran. And that’s because although iran’s run-up in the 10s was impressive, that is nothing to what happened in the previous decade. Figure 3 merges the national publication counts used in the past three UNESCO science reports in order to generate an estimate of the size of the increase in output (there is some jiggery-pokery involved here because the three reports used three different datasets, but because there were some years of overlap from the first report to the second and from the second to the third, it is possible to re-index growth at each overlap and make a continuous estimate of growth rates over 20 years – basically, view figure 3 as inexact but indicative). What it shows is that since the year 2000, Iran has perhaps seen the world’s fastest growth in scientific publications, with the rate of increase close to three times the rate in China, and over 4 times what it was in China.
Figure 3: Indexed Growth in Scientific Publications, Iran, China and India, 2000-2019 (2000 = 100)

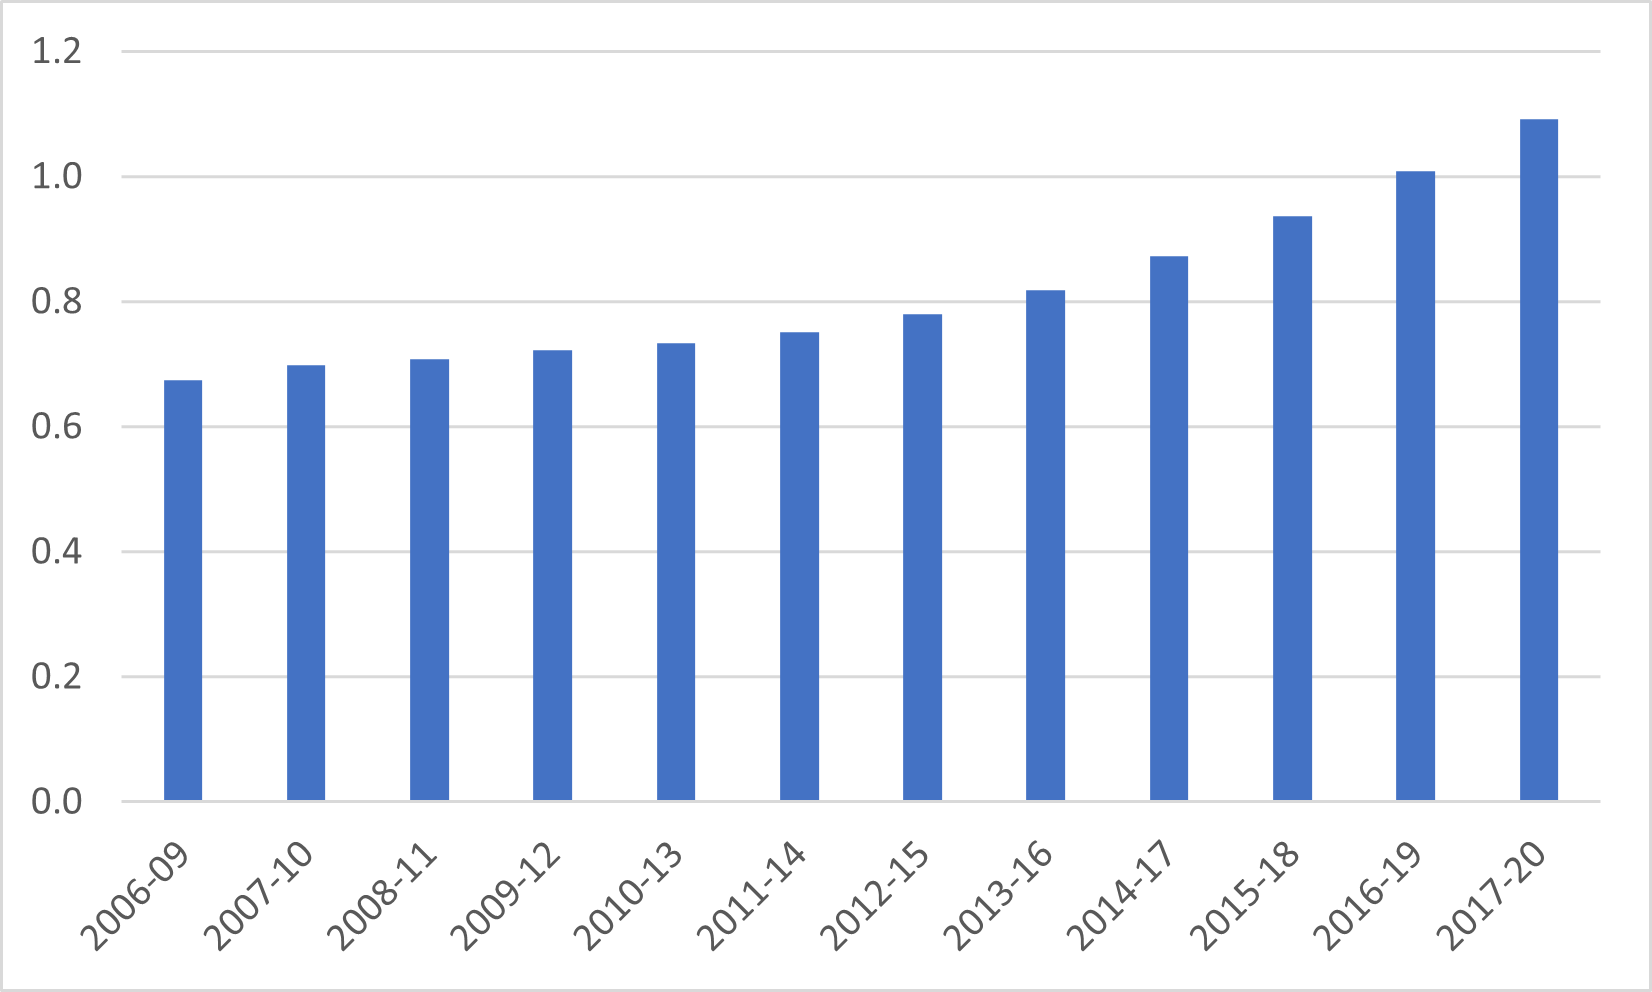
Now I know what you are thinking: might such explosive growth in the quantity of publications also imply a reduction in quality? Well, this proposition is testable for some of the years covered here using the Leiden Rankings database, which measures (among other things) field-adjusted citations. Here I show the average national mean normalized (i.e. field-adjusted) citation score at the country’s top 30 universities institutions, going back to 2007. Leiden calculates its outputs on a rolling four year-basis (e.g., 2006-09) so you tend not to see huge short-term shifts in the numbers, but again, Iran surprises. In 2006-09, the mean citation score of publications from Iran’s top universities was 0.675, meaning that on average the average Iranian scientific article was cited only about two-thirds as often as the average global scientific article, holding field of study constant. But things really began moving after about 2012, so that by the 2017-20 period, the average Iranian publication was cited slightly more often than the average global publication. Again, this represents one heck of a turnaround (and one to a large extent driven by the country’s medical science universities), not often seen in the annals of global science.
Figure 4: Mean Normalized Citation Scores, Top 30 Iranian Universities, 2006 to 2020
So there you go: a lot of countries out there to watch, but Iran in particular strikes me as being of particular importance, both as an example to the various countries currently in the take-off stage and as a potential partner if the current regime is ever replaced.
 Tweet this post
