The College Board has finally put new AP data up on its website after a hiatus of a couple of years. I had previously blogged about their decision to take it down from their website, after some attention that removal had received in the national press, and, unfortunately, some amplification by the right-wing elements who believe that differences in scores by ethnicity are driven by innate biological attributes, rather than things like parental attainment, family income, and opportunity, all of which look a lot like ethnicity to people who feel bad about themselves.
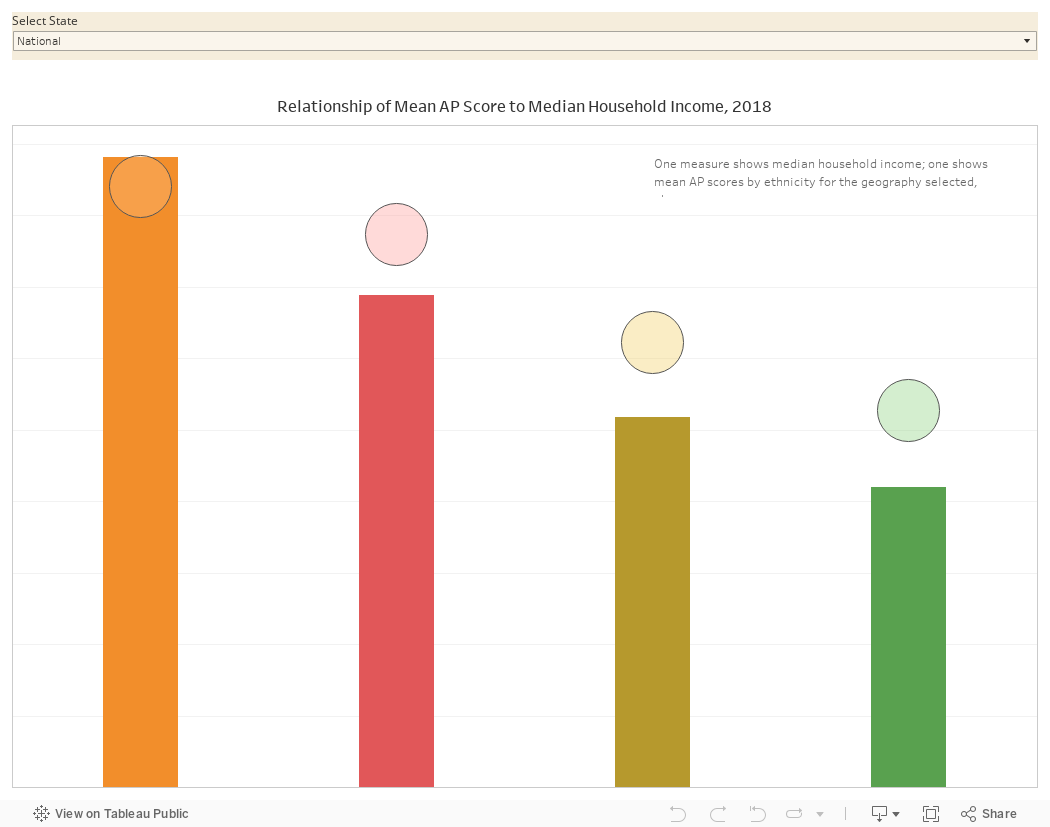
I did a special visualization for them to show some of these patterns. Choose national or state, and see how mean AP scores line up with median family income (the visualization is purposely abstruse, by the way, with no labels on the data points or axes.)
Anyway, the new data are up, but in different formats from those that had been previously provided. College Board (in its effort to "streamline reporting") have eliminated the data that included score breakouts by geography, ethnicity, and specific exams in one file. I took the new data and combined it with the old; I've spot checked the data to ensure as best I can that I merged the files accurately, but cannot guarantee that I did so, so use this data with caution. It's below, in five views:
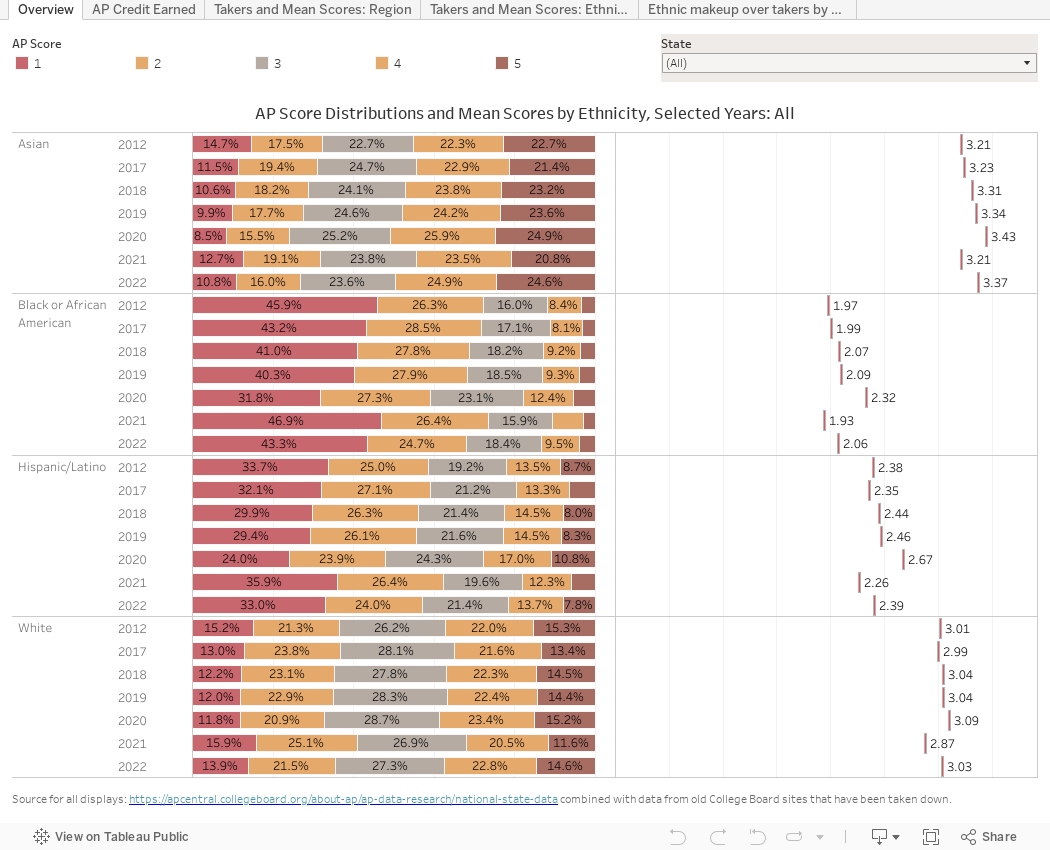
Overview shows the four largest ethnic group score distributions on the left, and mean scores on the right. You can filter on the state if you'd like. I kept it to four groups because some groups/state combinations are too small to draw adequate conclusions from (Asian/Pacific Islanders in South Dakota, for instance.) What I think I see on this is that the pandemic appears to have hit African American and Hispanic students harder than it did White and Asian groups. You draw your own conclusions.
AP Credit Earned breaks scores into two bands, with the (admittedly inaccurate) premise that scores of 3, 4, and 5 earn college credit. That may be true at many public institutions, but some colleges don't award any credit for AP scores, some insist on higher scores, and some vary the credit policy based on subject.
Takers and mean scores by region shows the number of test takers on bars, and mean scores on the lines. You can choose any combination of years in the data set (I recommend no more than three or four) and you can filter by ethnicity, or even actual scores if you'd like.
Takers and mean scores by ethnicity does the opposite: That is, it starts by breaking out by ethnicity and you can filter to regions if you'd like. Again, test-takers are on the bars, and mean scores are on the lines.
And finally, Ethnic makeup over time shows any years you select (I recommend choosing only two from the dropdown) and seeing how the composition of the AP pool of test takers has changed over time. You can see counts on the labels, but the display shows percentage of total.
As always, I'm interested to hear what you see here. Thanks to the College Board for putting this out, even if it's not exactly what I was hoping for.
Comments
Post a Comment