

About seven years ago, I wrote a blog looking at the house-buying power of academics in different parts of the country. I thought maybe it was time to do this again.
First, an overview of the methodology used six years ago. I took median academic salaries for major universities in Canada for the most recent year available, which at the time was 2010-1. Then I gathered salary data for all ranked academics, including those who hold senior academic positions such as Deans. To look at housing costs, I went to Numbeo.com, which is a database dedicated to providing comparative cost of living data for cities around the world. For each city in Canada, I queried the “cost per square metre to buy an apartment in the city centre”. Why this method? Because my 2016 article was riffing off an international version done by THE, and Numbeo was their data source. It was clear at the time that this was a somewhat wonky data source – the cost data for housing Kingston seemed pretty low, but hey – good enough for THE, good enough for a dude writing a blog trying to meet a deadline.
Dividing one figure by the other gave us the number of square metres of housing an annual average ranked academic paycheque could buy at 29 Canadian universities.
Figure 1: Square Metres of Housing Purchasable with Median Academic Salary, 2016 data
I went back to the same numbers for this re-do. I changed the numerator a bit (I included medical staff, which does not change the outcome all that much). But when it came to the denominator, I had to throw in the towel. Numbeo just isn’t a reliable enough source (housing prices in Quebec City are not 5x more than in Regina, for instance). Which is a shame because expressing housing costs by square metre is a clear way to standardize expenditures on what is a very heterogenous good.
So I tried something different: I took the most recent housing price for each metropolitan area as shown by the Canadian Real Estate Association as of yesterday, used that as the numerator (not the denominator, as last time) and divided it by the average professorial salary. So, what I show below is the ratio of housing prices to annual salaries, and unlike Figure 1, the higher the number, the lower the level of affordability. Got it? OK, here we go.
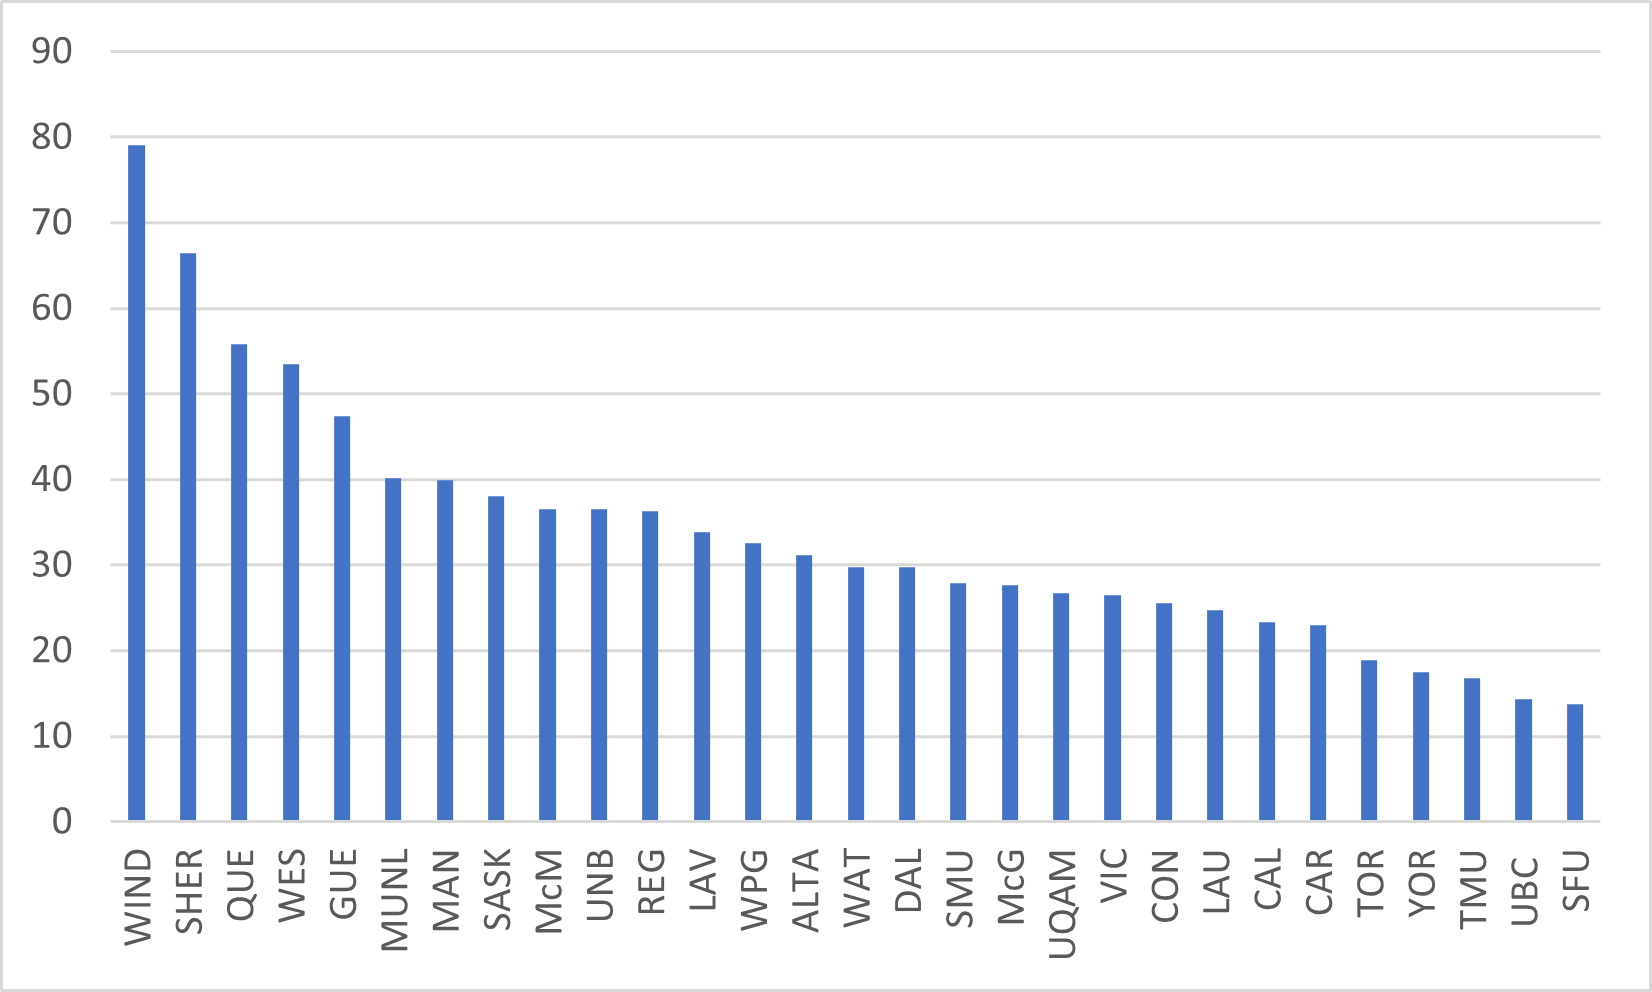
Figure 2: Ratio of Average Regional Housing Prices to Median Academic Salaries, 2023 data

Unsurprisingly, the places in Canada where the highest ratio of housing prices to annual median salaries are clustered in Ontario and British Columbia. But the gap between cities in Ontario and BC and places like Edmonton and Saskatoon are really striking. In effect, a professor at the University of Saskatchewan or the University of Alberta can buy about 3 times as much housing as one at UBC or York. Obviously, that doesn’t mean they will go and buy three houses; rather, it means that they can buy a more upmarket home for the same fraction of their salary. That should make offers for tenure-track positions a lot more attractive at these schools.
This method of portraying academic salaries exaggerates the differences in professorial standards of living across the country (no one pays for housing all at once out of current income), but it does underline why salary alone doesn’t really tell the whole story when it comes to faculty compensation.
 Tweet this post
