How to uncover hidden threats in past enrollment trends
What most institutions miss
June 20, 2023, By Brian Schueler, Director, Research Development
As we approach the beginning of a new academic year, campus leaders are already taking stock of their undergraduate enrollments. When thinking about enrollment growth over time, the most common approach is to compare this year’s total enrollment with last year’s, or perhaps a few years prior.
But this topline growth pattern offers only an incomplete picture of what’s going on, setting college and university leaders up to miss the real challenges and make the wrong course corrections. Instead, we should think of enrollment and how it changes as a combination of three key questions:
- How many potential students are there?
- How many of them end up enrolling in any college or university?
- How many of those who enroll end up at your institution?
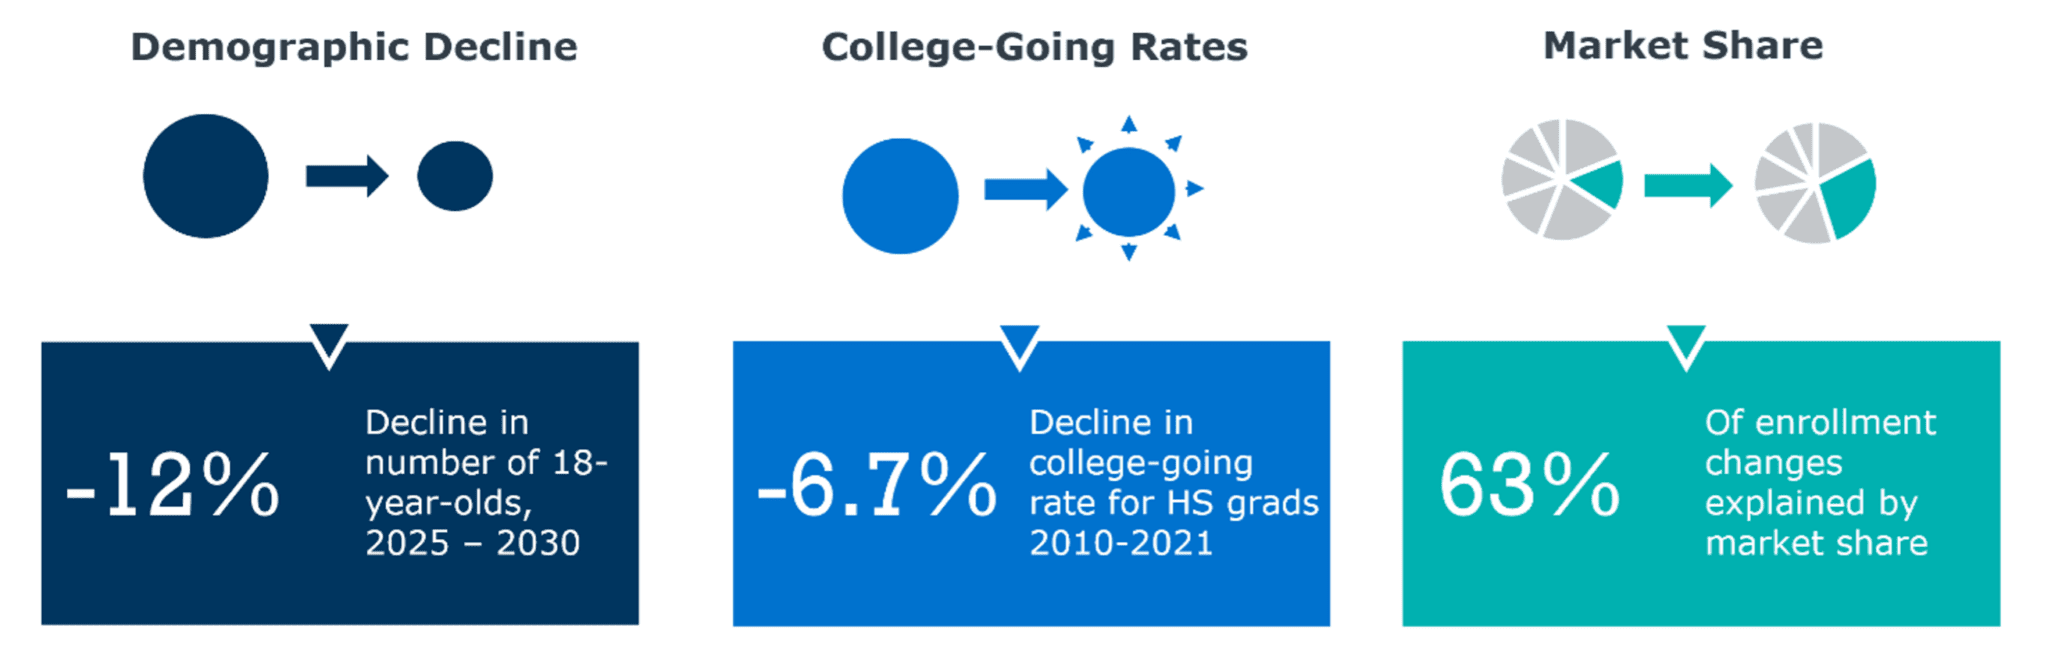
Campus leaders already have good answers to the first question about the potential number of students, particularly for the ~18-year-old undergraduate population. In our conversations with partners, most are already familiar with the coming demographic decline that will start around 2025. Even leaders not immersed in the day-to-day realities of enrollment management are well aware of the coming contraction.
But fewer leaders are familiar with how the share of these potential students who will enroll is changing—college-going rates. And while many know generally that competition between institutions plays a role in enrollment outcomes, it’s rarer still to find a leadership team aware of how their share of all enrolled students, and the shares of other institutions, are shifting over time—market share.
To help our partners answer these questions, we developed the Undergraduate Enrollment Outlook. This tool brings all three of these forces (demographics, college-going rates, and market share) together into a collection of institution-specific analyses based on your institution’s enrollment data.
The enrollment equation: much more than demographics
An institution’s enrollment is the product of the number of potential students, the college-going rate, and its share of these college-going students. While understanding demographic decline is useful, it’s only one component of the equation. Adding in the context of changing college-going rates and market share trends allows us to uncover a fuller picture. This added context helps us better evaluate past performance and identify strategic opportunities for future growth.
When leadership teams evaluate their institution’s past enrollment performance, very few consider all parts of this equation simultaneously. This can leave positive trends unrecognized and may obscure concerning developments.
Growing market share suggests that the institution’s enrollment and recruitment efforts are getting something right—even if the result is still a decline in total enrollment due to demographic shifts. On the other hand, declining market share may signal serious competitive challenges that could become a problem, even if population growth hides these losses. If a decline is due primarily to falling college-going rates, the question may be less about how you compete with other institutions, and more about how you compete against alternatives to higher education like work, family obligations, or misperceptions about higher education’s value.
The first step: disaggregate past enrollment trends to evaluate your real challenges
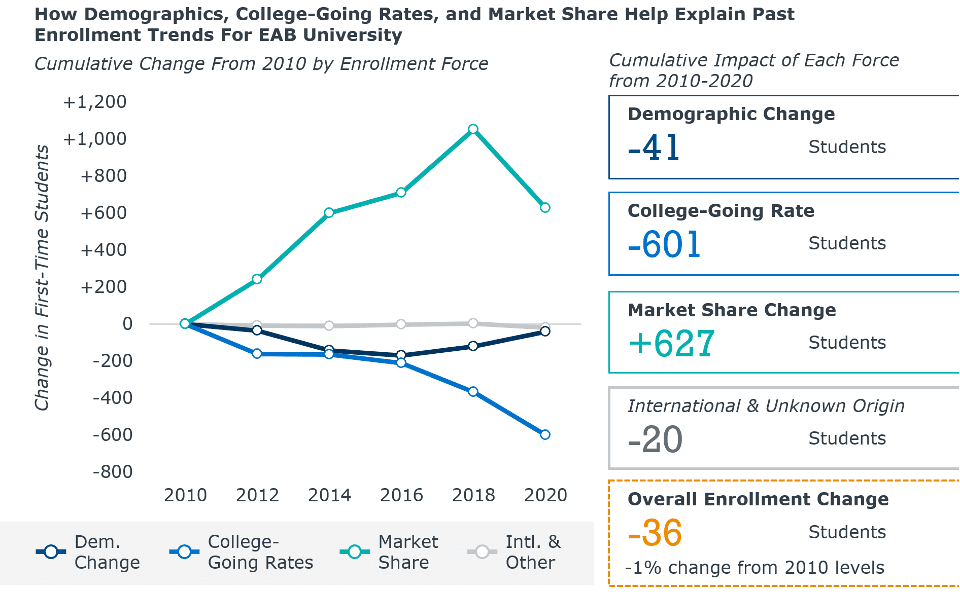
Consider the example below of EAB University*, a real institution in the Mid-Atlantic. Over the past decade, the institution’s first-time enrollments declined by about 1%—not a disaster, but still not great. But when we break out the separate enrollment forces, what we see is an institution that successfully grew its market share to compensate for a challenging enrollment landscape. The chart below displays the cumulative change in enrollment disaggregated by each enrollment force from 2010 to 2020.
*Pseudyonym
For EAB University, demographic decline wasn’t the problem
The dark navy line, which shows the cumulative impact of demographics on EAB University’s enrollment. Between 2010 and 2016, the number of 18-year-olds in EAB University’s main markets fell, reducing enrollment by close to 150 students. However, since 2016, demographics have actually grown. From 2010 to 2020, demographic changes explain a reduction of only about 41 students for EAB University.
Declining college-going: the true culprit
The lighter blue line shows the cumulative impact of college-going rates on EAB U’s enrollment. College-going rates in the Mid-Atlantic have declined since 2010 with a more rapid decline occurring from 2016 through 2020. Our analysis estimates that these declines led to a loss of around 600 students for the institution, which is almost 15x the number of students lost as a result of demographic decline.
Market share growth indicates competitive position
The reason EAB University managed to maintain level enrollments over the longer term was due to big increases in market share. Increases in market share across the states the institution recruits from led to an increase of more than +1,000 students in 2018, a figure that fell back down to +627 in 2020.
Out of all the students who ended up enrolling in a higher ed institution, a greater proportion of them chose EAB University in 2020 compared with 2010. Simply put, EAB U. became more competitive than other institutions.
Market share doesn’t just provide insights into your own institution’s competitive position—it can also help identify the position of other competitors in your markets. Institutions growing market share in your key markets are likely to become your future competition if they aren’t already. The Undergraduate Enrollment Outlook not only reveals your own institution’s overall market share, but through a comparative analysis can identify which of your competitors pose a threat to your market share in your primary, secondary, and tertiary markets.
The next step: bolster your winning strategies and address your threats
While this information is compelling, it’s only the start. Insights are only as valuable as the changes they inspire. Our researchers use this analysis to help institutions identify the right questions for the cabinet and enrollment leaders to focus on when setting enrollment strategy. In EAB University’s example, the data raises three core questions:
- What did we do well from 2010 to 2018 that grew our market share? How can we amplify those efforts moving forward?
- Which competitors pulled students away in 2020? How do we position our institution vis-à-vis these competitors?
- Which students aren’t going to college, reducing the college-going rate? What can we do to serve this population and address their needs?
Facilitating data-driven discussions around future enrollment is just one component of the work we do in Strategic Advisory Services to help our partners identify and act on strategic goals. If you’re interested in this analysis and how our experts can work with your teams, learn more and connect with our enrollment experts here.

More Blogs

Crisis response 101 for enrollment teams

6 proven ways to boost your college enrollment