Remove demographics native-americans
article thumbnail

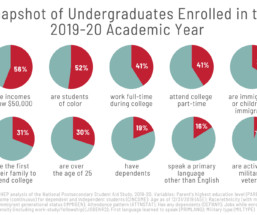
A Snapshot of Today’s College Students

IHEP

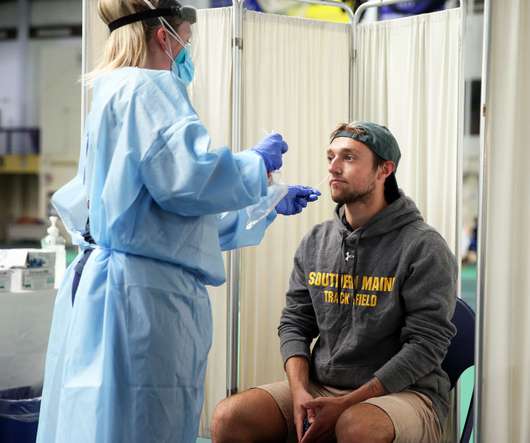
These data show that students who identify as Black, Hispanic or Latino, Asian American, Native Hawaiian or Pacific Islander, or American Indian or Alaska Native make up the majority (52 percent) of undergraduate enrollment. NPSAS provides information on students’ self-reported race and ethnicity, across six categories.

College 86
article thumbnail

First-Time Graduate Enrollment Rises, But Declines Domestically

Diverse: Issues in Higher Education

Several racial demographics domestically – including underrepresented minorities (URM) – saw declines, with first-time graduate enrollment falling 5.7% for American Indian/Alaska Native students, 4.1% for Black/African American students, and 0.9% among Black/African Americans, 0.9% for white students, 4.5%

university leaders

Sign Up for our Newsletter

This site is protected by reCAPTCHA and the Google Privacy Policy and Terms of Service apply.

article thumbnail

How Data Drives Student Success

Diverse: Issues in Higher Education

LaGuardia is an MSI twice over — it meets the minimum demographic thresholds to qualify as a Hispanic Serving Institution (HSI) and an Asian American Native American Pacific Islander Serving Institution (AANAPISI). Forty-four percent of undergraduate enrollment is Latinx, and 20% is Asian American.

Students 129
article thumbnail

Report: More Women and Communities of Color in STEM Than in Past Years

Diverse: Issues in Higher Education

To note, despite the increases for the aforementioned demographics, these groups – and those with disabilities – remain underrepresented in STEM compared to their percentage in the U.S. And although Hispanic, Black, American Indian, and Alaska Native people comprise 31% of the population, they comprise only 24% of the 2021 STEM workforce.

article thumbnail

Kentucky Attorney General Argues Against DEI Policies

Insight Into Diversity

Underrepresented minorities, as currently defined in Kentucky, encompass individuals identifying as Hispanic or Latino, American Indian or Alaska Native, Black or African American, Native Hawaiian or Pacific Islander, or two or more races.

Policy 52
article thumbnail

Mental health remains the top concern for students

University Business

Specific demographics of students who were experiencing mental health issues at a substantially high level are transgender (93%), non-binary (91%), and Native Hawaiian/Other Pacific Islander Natives (83%). More from UB: Monkeypox and COVID-19 are not concerns for college students, but these 4 issues are.

Students 105
article thumbnail

Updated educational attainment data show progress and gaps

Inside Higher Ed

The national share of working-age Americans who hold college degrees increased across racial and ethnic groups and rose in all states between 2019 and 2021. But Black, Latino and Native American adults still hold degrees at rates well below other Americans. percent) and roughly a quarter of Native American adults (25.4